⭐ Think
The height of 10 students in our class was measured to see how tall they were. The measured height data were recorded on paper as follows:
| 165 163 170 175 155 167 157 153 161 162 |
- Examine what statistics is.
- Examine the classification of data.
- Examine statistical software.
| 165 163 170 175 155 167 157 153 161 162 |
Students' heights are called numerical data. In this example, the data was generated as many as the number of students. In our society, a large amount of data were generated and the number of data is expected to increase further with the development of computer technologies in the future.
In order to understand the relative position of my height among students, arrange the data in descending order from taller to smaller as shown in [Table 1.2].
| 175 170 167 165 163 162 161 157 155 153 |
From this data, it is easy to tell that my height of 165cm is the 4th from the top.
Statistics is the process of collecting, organizing, and summarizing data in this way and obtaining useful information by analysis. A country needs statistics such as the number of people, the number of households, and the amount of food in order to solve eating, clothing and sheltering of its people. Such statistics have been recorded since the time of Egyptian civilization 5,000 years ago.
As the modern information society progresses, the size of data has grown
tremendously, which is called Big Data. Typical examples of big data
are as follows:
In the information society of the future, the success or failure of an individual,
company, or country can be different depending on how they make scientific
decisions with reasonable statistical information on big data. There are many
examples of statistics applied to reality by analyzing big data.
Data are values that observe or measure the attributes of objects of interest. The attribute of such an object or event is called a variable. For example, if the gender and height of an elementary school were measured, there were two variables (gender and height). Gender measurements are in the form as male, female, female, male, .... and height measurements are 160cm, 155cm, 158cm, 165cm, ...
Variable such as 'gender' is classified into qualitative data, and variable such as height is classified into quantitative data. The reason for classifying data is that processing and analyzing methods are different depending on the type of data. Chapter 2 discusses visualization of qualitative data, and Chapter 3 discusses visualization of quantitative data.
Qualitative variable such as gender usually have several categories, which are also called a categorical variable. For a categorical variable, the frequency of each category is investigated, a frequency table is created, and a bar graph, pie graph, and band graph are drawn for analysis (Chapter 2). Table 1.3 is an example of a frequency table for gender in a class. It shows that there are 6 'male' and 4 'female' students.
| Gender | Number of Students |
|---|---|
| Male | 6 |
| Female | 4 |
Qualitative data such as words are analyzed by examining the frequency of each word to form a word cloud.
For quantitative data, the mean and standard deviation are calculated and visualized using stem and leaf plot, histogram, and dot graph (Chapter 3).
Small class data can be manually organized and analyzed, but if there are more data, it is impossible to analyze data without the help of a computer. In particular, statistical software with many professional analysis programs is essential for big data analysis. Statistical software such as SAS, SPSS, and R are now widely used for data analysis. However, these software are not easy for beginners to learn, and SAS and SPSS are commercial and are very expensive. In addition, these software are focused on data analysis and there are few modules required for statistical education.
『eStat』 is a free educational software designed to teach statistics easily from elementary school students to college students and general public. Given the data, you can draw a graph with just a click of the mouse, and experience a dynamic graph. 『eStat』 includes many examples from textbooks of each level, and because it is web-based, users can use it anytime, anywhere with a PC, tablet, or smartphone. 『eStat』 is provided free of charge and supports multiple languages, and currently 20 languages, including Korean and English are available.
『eStat』 system works 100% well with Google's Chrome among many web browsers currently in use. In browsers such as MS Edge, 『eStat』 works, but some functions may not work.
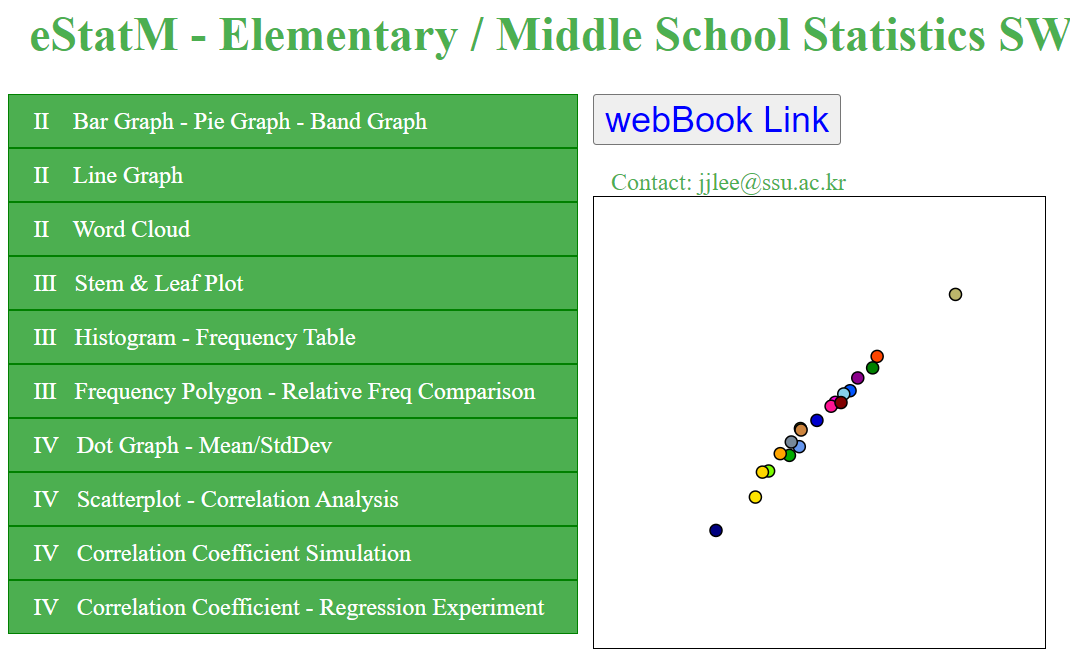
This book is focused on modules in 『eStatM』 developed for elementary and middle school students in 『eStat』. Open the web browser Chrome, enter www.estat.me in the address bar and click the icon 『eStatM』, then the screen as shown in <Figure 1.1> appears.
